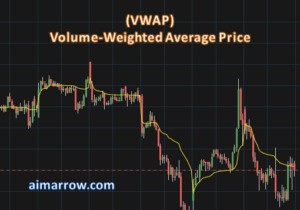
Everything About Volume-Weighted Average Price (VWAP) Technical Analysis Indicator
Introduction: What is Volume-Weighted Average Price (VWAP)?
Volume-Weighted Average Price (VWAP) is a widely used technical analysis indicator in the stock market. It provides traders with valuable insights into the average price at which a security has traded throughout the day, based on both price and volume. In this article, we will delve into the history, definition, parameters, calculation, application, best practices, and misconceptions surrounding VWAP. We will also explore its pros, cons, risks, rewards, success rate, and its applicability to stock, commodity, and currency trading.
History of VWAP Technical Analysis Indicator:
VWAP was first developed in the early 1990s by a group of traders at Goldman Sachs. The indicator quickly gained popularity among traders and analysts, and it is now one of the most widely used technical analysis tools.
VWAP was initially used by institutional traders to assess the efficiency of their executions and to evaluate their trade performance against the average price for a given period. Over time, it gained popularity among retail traders due to its ability to provide insights into intraday price trends.
Understanding VWAP in the Stock Market:
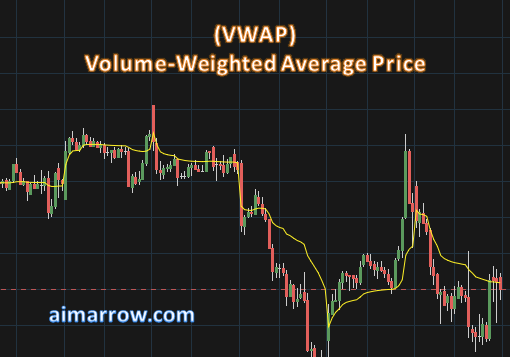
VWAP is a technical indicator that calculates the average price at which a security has traded throughout the day, taking into account both price and volume. It helps traders assess whether a security is being traded above or below its average price and provides a benchmark for evaluating trade executions.
An Analogy to Explain VWAP:
Think of VWAP as a “weighted price anchor.” Just as an anchor keeps a ship steady by accounting for both weight and volume, VWAP represents the average price that takes into consideration the volume traded at each price level.
Volume-Weighted Average Price (VWAP) Parameters:
The primary parameter of VWAP is the time period over which the average price is calculated. It can be customized based on the trader’s preference, typically ranging from a few minutes to the entire trading day.
- Timeframe: The timeframe can be set to any time period, such as 1 minute, 5 minutes, or 1 hour.
- Price: The price can be set to the closing price, the open price, or the average price.
- Volume: The volume can be set to the total volume, the average volume, or the volume-weighted average volume.
Formula of Volume-Weighted Average Price (VWAP):
It is calculated by dividing the total dollar value of trading in the security by the volume of trades i.e., each trade’s price is multiplied by its corresponding volume, and the sum of these values is divided by the total volume traded within the chosen time period.
VWAP is calculated using the following formula:
VWAP = ∑(Price × Volume) / ∑Volume
(or)
VWAP = (Cumulative Dollar Volume / Cumulative Volume)
VWAP can be calculated manually, but it is more commonly calculated by using charting software. Charting software will typically have a built-in VWAP indicator that can be easily added to a chart.
Default VWAP Settings:
As VWAP is a customizable indicator, there are no default settings. Traders can adjust the time period based on their preferred trading timeframes.
However, the most commonly used VWAP settings include intraday timeframes such as 30 minutes, 1 hour, or the entire trading day. Traders may choose different periods based on their trading style and goals.
Volume-Weighted Average Price (VWAP) Buy and Sell Signals:
VWAP can generate buy signals when the price is consistently above the VWAP line, indicating bullish sentiment. Conversely, sell signals may occur when the price consistently falls below the VWAP line, indicating bearish sentiment.
Different Purposes of using VWAP:
Identify support and resistance levels: VWAP can be used to identify support and resistance levels, which are important areas for traders to watch for potential reversals in price.
To determine the optimal entry and exit points: VWAP can be used to determine the optimal entry and exit points for trades, by looking for opportunities to buy or sell when the price is close to the VWAP.
Measure the performance of a trading strategy: VWAP can be used to measure the performance of a trading strategy, by comparing the average price of trades to the VWAP.
How to Use Volume-Weighted Average Price (VWAP):
Traders use VWAP to identify whether a security is trading above or below its average price, gauge the intraday trend, and assess the quality of trade executions. It is commonly used for short-term trading strategies.
VWAP can be used in a variety of ways, but here are a few common strategies:
Buy when the price is below VWAP and sell when the price is above VWAP: This is a simple strategy that can be effective for traders who are looking to trend-follow.
Buy when the price breaks above VWAP and sell when the price breaks below VWAP: This strategy is more aggressive than the previous one, and it can be used to take advantage of short-term price movements.
Use VWAP as a moving average: VWAP can be used as a moving average, which can be helpful for identifying trends and support and resistance levels.
Best Practices while using VWAP indicator:
To enhance the effectiveness of VWAP, traders often combine it with other indicators such as moving averages, trend lines, or oscillators. This combination provides additional confirmation and helps filter out false signals.
- Use VWAP in conjunction with other indicators and tools.
- Consider the overall market trend and volume patterns.
- Assess the quality of trade executions based on VWAP.
- Regularly adjust the VWAP period based on market conditions.
Pros and Cons of Volume-Weighted Average Price (VWAP):
Pros:
- VWAP is a simple and easy-to-understand indicator.
- Helps identify intraday price trends and market sentiment.
- VWAP can be used to identify support and resistance levels.
- It can be used to determine the optimal entry and exit points for trades.
- Reflects the average price considering both price and volume.
- VWAP can be used to measure the performance of a trading strategy.
- Provides a benchmark for evaluating trade executions.
Cons:
- VWAP can be lagging, meaning that it may not react to price movements quickly. It may lag in rapidly changing or volatile markets.
- Relies on historical data and may not account for unexpected events. For example, VWAP can be affected by large orders, which can cause the indicator to spike or dip.
- VWAP is not a perfect indicator, and it should not be used as the sole basis for making trading decisions.
- Requires skill and experience to interpret and apply effectively.
Risks of Using VWAP:
Using VWAP as the sole basis for trading decisions carries risks. It’s essential to consider other factors such as market context, news events, and fundamental analysis to avoid potential false signals and unexpected price movements.
Rewards of Using VWAP:
When used correctly, VWAP can enhance trading decisions, identify optimal entry and exit points, and provide insights into market trends. Integrating VWAP into a comprehensive trading strategy can potentially improve profitability and risk management.
Whipsaws of Volume-Weighted Average Price (VWAP):
Whipsaws can occur when the price frequently crosses above and below the VWAP line, generating false signals. Traders should exercise caution during such periods and consider additional confirmation indicators.
Common Misconceptions of about VWAP:
One common misconception is that VWAP predicts future price movements with certainty. VWAP is a lagging indicator that reflects past price and volume data. It should be used as part of a broader analysis framework.
Success Rate of VWAP Technical Indicator:
The success rate of VWAP varies depending on the asset class being traded, market conditions, timeframes, trader’s skills, and the trading strategy being employed. Like any trading indicator, its effectiveness is influenced by the trader’s ability to interpret signals accurately and align them with the overall market context. However, in general, VWAP is a relatively reliable indicator.
Applicability to Stock, Commodities, and Currency Trading:
VWAP can be used in various trading markets, including stocks, commodities, and currencies. However, there are some differences in how the indicator is used for each asset class.
For example, in stock trading, VWAP is typically used to identify support and resistance levels, while in commodities trading, VWAP is more commonly used to determine the optimal entry and exit points for trades. It’s crucial to adapt the indicator’s parameters and settings to suit the characteristics of each market, such as liquidity and trading hours.
Conclusion:
Volume-Weighted Average Price (VWAP) is a valuable technical analysis indicator that provides traders with insights into intraday price trends, trade executions, and market sentiment. By understanding its history, calculation, application, and associated risks, traders can effectively incorporate VWAP into their trading strategies. Remember to combine VWAP with other indicators, adjust settings based on market conditions, and consider broader market factors for optimal results in stock, commodity, and currency trading.
VWAP is a versatile technical analysis indicator that can be used for a variety of purposes. It is a simple and easy-to-understand indicator, but it can also be used to identify support and resistance levels, determine the optimal entry and exit points for trades, and measure the performance of a trading strategy.
We encourage you to participate in the following fan poll on fanrank.org:
Crown the best technical indicator
Vote for the best mobile app for trading and investing