Moving Averages Technical Analysis Indicators – History, Types, Uses, Pros & Cons, Misconceptions, Commonly Used MAs and Best Practices
Introduction:
Moving Averages (MA) are a popular and versatile technical analysis indicator used by traders and investors to identify trends, confirm price patterns, and generate buy or sell signals. In this article, we will delve into the history, types, formulas, applications, and best practices of moving averages.
We’ll also explore their advantages, disadvantages, risks, rewards, and common misconceptions, while addressing whether moving averages can be effectively used across various markets, including stocks, commodities, and currencies.
History of Moving Averages:
The concept of moving averages dates back to the early 20th century, when traders sought a way to smooth out price fluctuations and identify the underlying trend. The pioneering work of technical analysts such as Richard Donchian and Charles Dow contributed to the development and refinement of moving averages. Dow believed that MAs could be used to identify trends and potential buying and selling opportunities.
What are Moving Averages?
Moving averages (MAs) are a type of technical analysis indicator that smooths out price data by calculating the average price over a specified period of time. This helps to identify trends and support and resistance levels.
Moving averages in the stock market refer to the average price of a security over a specified period. They provide a visual representation of price trends and assist traders in identifying potential entry and exit points.
An Analogy to Explain Moving Averages:
Imagine driving a car through varying landscapes. Moving averages act as the windshield that allows you to see the road ahead more clearly by smoothing out the bumps and providing a clearer view of the overall direction you’re heading.
Different Types of Moving Averages
There are three main types of moving averages: Simple Moving Average (SMA), Exponential Moving Average (EMA), and Weighted Moving Average (WMA). Each type has its own calculation method and characteristics, with Exponential Moving Average (EMA) placing more emphasis on recent prices, where as Weighted Moving Average (WMA) assigns different weights to the data points, and Simple Moving Average (SMA) providing equal weight to all data points.
- SMAs are calculated by adding up the closing prices of a security over a specified period of time and dividing by the number of periods.
- EMAs are calculated by assigning more weight to recent prices than to older prices. This makes EMAs more responsive to changes in price than SMAs.
- WMAs are calculated by assigning different weights to the data points in the calculation. The weights are determined based on the position of each data point within the specified period.
How to Use Moving Averages
Traders utilize moving averages in different ways, including identifying trend direction, determining support and resistance levels, and employing moving average crossovers as entry and exit signals. These tools can be tailored to fit individual trading strategies.
Identifying trends: Moving averages can be used to identify trends by looking for when the price crosses above or below a moving average.
Identifying support and resistance levels: Moving averages can be used to identify support and resistance levels by looking for where the price repeatedly bounces off of a moving average.
Identifying potential buying and selling opportunities: Moving averages can be used to identify potential buying and selling opportunities by looking for when the price crosses above or below a moving average. Moving averages generate buy signals when the price crosses above the moving average line, indicating a potential uptrend. Conversely, sell signals occur when the price crosses below the moving average, suggesting a potential downtrend.
Best Practices for Using Moving Averages
To maximize the benefits of moving averages, it’s crucial to choose appropriate timeframes, adjust settings based on market conditions, combine them with other indicators for confirmation, and regularly review and adapt the strategy to evolving market dynamics.
There are a few best practices for using moving averages, including:
- Use multiple moving averages: Using multiple moving averages of different lengths can help confirm trends and identify potential buying and selling opportunities.
- Use a stop-loss: A stop-loss is a predetermined price at which you will sell a security if the price falls below that level. This helps to protect your profits and limit your losses.
- Use a risk-reward ratio: A risk-reward ratio is a measure of the potential profit from a trade compared to the potential loss. This helps you make informed decisions about when to enter and exit trades.
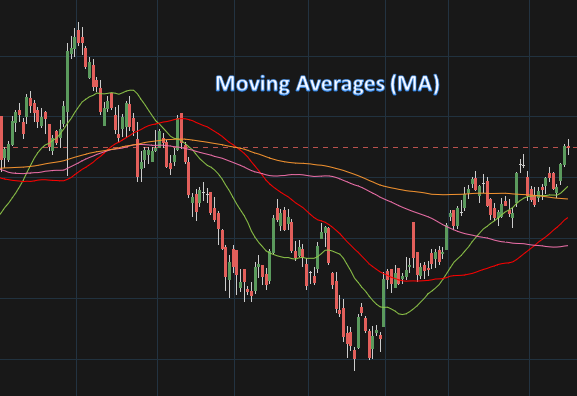
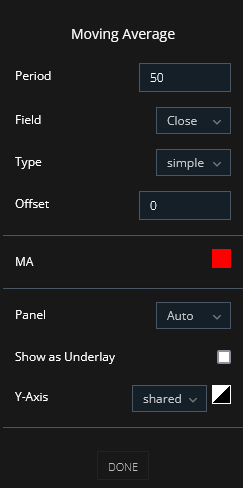
Moving Average (MA) Settings on Chart
Pros and Cons of Moving Averages
Moving averages are a popular technical analysis indicator, but they do have some drawbacks.
Pros:
- Moving averages are easy to understand and use. They provide a clear visual representation of market sentiment and help filter out noise.
- Moving averages can be used to identify trends, support and resistance levels, and potential buying and selling opportunities.
- Moving averages can be used with other technical analysis indicators to improve the accuracy of trading signals.
Cons:
- Moving averages are lagging indicators, which means that they can lag behind rapid price changes, leading to delayed signals, missed opportunities, or late entries into trades.
- Moving averages can produce false signals during choppy or sideways markets, which can lead to losses.
- Moving averages are not a guarantee of success in trading.
Risks of Using Moving Averages
As with any technical analysis indicator, there are risks associated with using moving averages. These risks include:
- False signals: Moving averages can produce false signals, which can lead to losses.
- Overtrading: Moving averages can be used to identify potential trading opportunities, but it is important to avoid overtrading.
- Market volatility: Moving averages can be less effective in volatile markets.
- Whipsaws: A whipsaw is a sharp, quick price movement that quickly reverses direction. Whipsaws can occur when moving averages are used to identify trading signals.
Rewards of Using Moving Averages
Moving averages provide traders with a structured framework for analyzing price trends, confirming patterns, and making informed trading decisions. They can contribute to consistent profits when used appropriately.
The rewards of using moving averages include:
- Identify trends: Moving averages can be used to identify trends, which can help traders make better trading decisions.
- Identify support and resistance levels: Moving averages can be used to identify support and resistance levels, which can help traders identify potential buying and selling opportunities.
- Identify potential buying and selling opportunities: Moving averages can be used to identify potential buying and selling opportunities, which can help traders make more profitable trades.
Common Misconceptions
There are a few common misconceptions about moving averages, including:
- Moving averages are always accurate: Moving averages are lagging indicators, which means that they can lag behind price movements.
- Moving averages are a guarantee of success in trading: Moving averages are not a guarantee of success in trading.
- Moving averages are the only technical analysis indicator that is needed: Moving averages are just one of many technical analysis indicators that can be used to identify trading opportunities.
Can Moving Averages Be Used for Stock, Commodities, and Currency Trading Alike?
Yes, moving averages can be used for stock, commodities, and currency trading alike. However, it is important to choose the right moving average for the type of asset that you are trading. It is also essential to consider market-specific characteristics, such as trading hours, liquidity, and volatility, when selecting appropriate periods and types of moving averages. For example, a shorter moving average may be more appropriate for trading stocks, while a longer moving average may be more appropriate for trading commodities or currencies.
Here are some examples of how moving averages can be used for different types of assets:
Stocks: A short-term moving average, such as a 10-day moving average, can be used to identify short-term trends in the stock market. A longer-term moving average, such as a 200-day moving average, can be used to identify long-term trends in the stock market.
Commodities: A short-term moving average, such as a 5-day moving average, can be used to identify short-term trends in the commodity market. A longer-term moving average, such as a 20-day moving average, can be used to identify long-term trends in the commodity market.
Currencies: A short-term moving average, such as a 10-day moving average, can be used to identify short-term trends in the currency market. A longer-term moving average, such as a 200-day moving average, can be used to identify long-term trends in the currency market.
It is important to note that moving averages are not a guarantee of success in trading. They are simply tools that can be used to identify potential trading opportunities. As with any investment, it is important to do your own research and understand the risks involved before making any trades.
Most Commonly Used Moving Averages
The choice of periods for Simple Moving Average (SMA), Exponential Moving Average (EMA), and Weighted Moving Average (WMA) in the stock market depends on various factors, including the trading strategy, time horizon, and the specific market being analysed. While there are no fixed rules, here are some commonly used periods for each type of moving average:
Simple Moving Average (SMA): The choice of SMA period depends on the trader’s preference and the time frame being analysed. Some commonly used SMA periods in the stock market include:
- Short-term SMA: 10-day, 20-day, or 50-day SMA
- Medium-term SMA: 50-day, 100-day, or 200-day SMA
- Long-term SMA: 200-day or 250-day SMA
Exponential Moving Average (EMA): EMA places more weight on recent prices, making it more responsive to price changes compared to SMA. Popular EMA periods in the stock market include:
- Short-term EMA: 10-day or 20-day EMA
- Medium-term EMA: 50-day or 100-day EMA
- Long-term EMA: 200-day or 250-day EMA
Weighted Moving Average (WMA): WMA assigns different weights to each data point based on their position within the specified period. While the choice of WMA periods varies, some commonly used ones are:
- Short-term WMA: 5-day or 10-day WMA
- Medium-term WMA: 20-day or 50-day WMA
- Long-term WMA: 100-day or 200-day WMA
Long-term moving averages are commonly used by position traders and investors focused on long-term trends.
It’s important to note that these periods and timeframes are not fixed rules or universally applicable and can vary depending on individual preferences, market conditions, and trading strategies. Traders and investors should consider their trading style, time frame, and the characteristics of the specific stock or market being analyzed. Additionally, it’s common for traders to combine multiple moving averages with different periods to gain a comprehensive view of the market and confirm trends.
Ultimately, the choice of moving average periods and timeframes should align with your trading style, goals, and the specific characteristics of the stocks or markets you are analyzing. It’s recommended to experiment with different periods and timeframes to find the ones that work best for your trading approach.
Conclusion:
Moving averages are a versatile technical analysis tool widely employed by traders across different markets. By understanding their history, types, formulas, and best practices, traders can harness the power of moving averages to identify trends, generate signals, and make informed trading decisions. While recognizing the advantages, disadvantages, risks, and rewards associated with moving averages, traders can avoid common misconceptions and leverage these indicators effectively in their pursuit of financial success.
We encourage you to participate in the following fan poll on fanrank.org:
Crown the best technical indicator
Vote for the best mobile app for trading and investing