More and more pain looming in Bank Nifty!
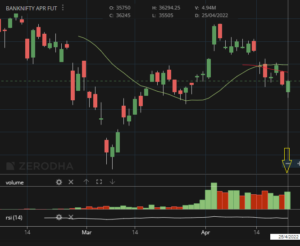
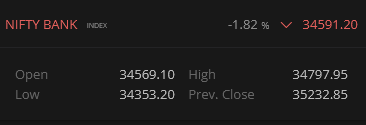
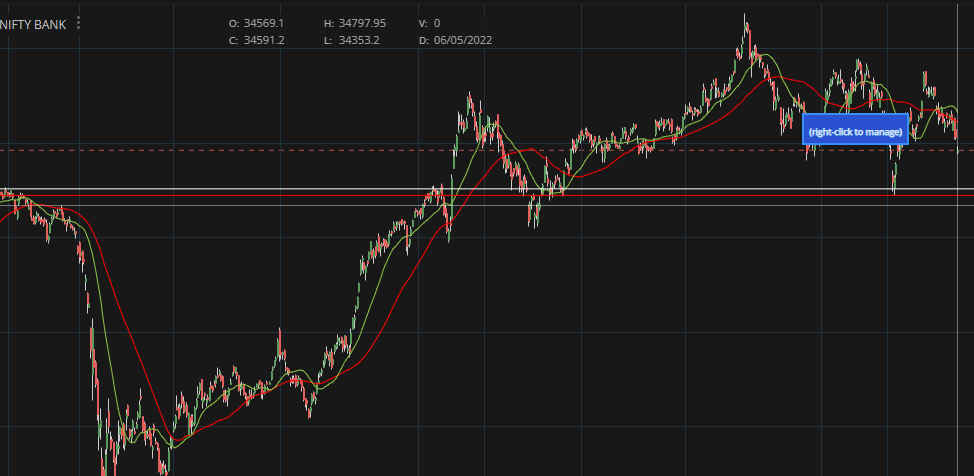
Bank Nifty OHLC on 6 May 2022
Bank Nifty continued it’s downward journey, with a huge gap down of -663.75 points at 34569.10 from it’s previous day’s close of 35232.85 on Friday. It held 34500 level and soon marked it’s day’s low at 34353.20 at 10:30PM. Later, bank nifty moved in around a range of 350 points and had marked a high of 34797.95. Alert was given on our telegram channel at 11:07 AM on Friday, to be careful if one was short on bank nifty, and in the rest of the trading session it did not break the day’s low.
Bank nifty closed at 34591.20, almost near the opening level forming a doji candlestick.
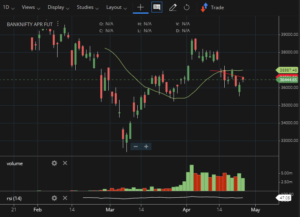
What does Bank Nifty’s EOD Chart tell us?
The trend clearly is sell on rally and a break of 34000 may lead bank nifty to test 3200-100 level (Dec 2019 highs) again.
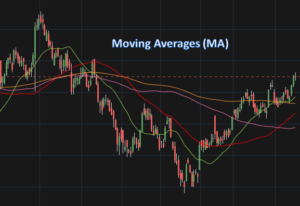
As mentioned above bank nifty has formed a doji candlestick and is trading well below it’s 21 day moving average. Another observation to note is that on the weekly chart of bank nifty, the 21 day moving average had moved below the 50 day moving average for the first time since March 2020. The crossover is also indicating more bearishness in the market in the upcoming days.
RSI and Volume Check
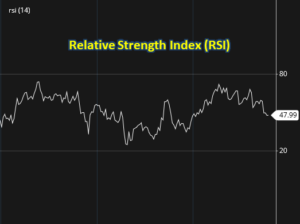
RSI on all the higher timeframes i.e. monthly, weekly and daily are indicating bearishness.
RSI (34.52) < Weekly RSI (42.29) < Monthly RSI (53.99)
The intense selling continued for the fifth trading session, and another red Volume bar was formed, with a volume of 13.60M.
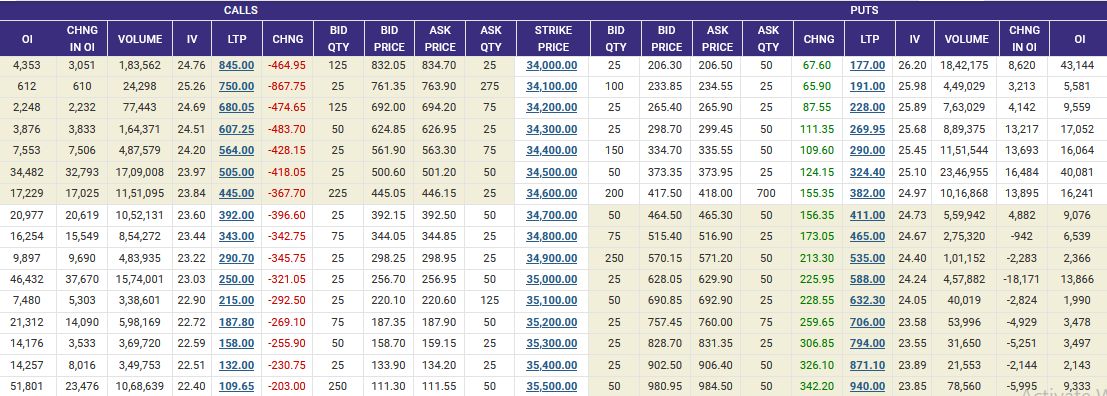
Bank Nifty Open Interest (OI)
Calls: The highest OI and volume is at 35000 closely followed by 35500, and 36k indicating immediate resistance.
The premiums on calls have reduced and OI has increased, clearly indicating short buildup on the call side. 36k looks to be strong resistance for the this week’s expiry.
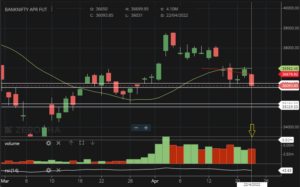
Resistance Levels: 34800, 35000, 35400-500, 35740, 36216 (Charts + OI)
Puts: The highest OI on the put side is at 34500 with decent OI and volume, followed by 34000. The put premiums have increased with an increase in OI, suggesting long buildup on the put side.
Support Levels: 34000, 33540-33580 (Charts + OI)
The option chain is clearly indicating more pain in the market, unless it breaks 36k decisively and holds above it.
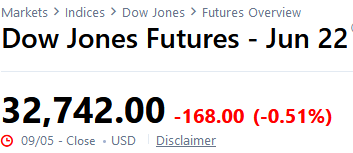
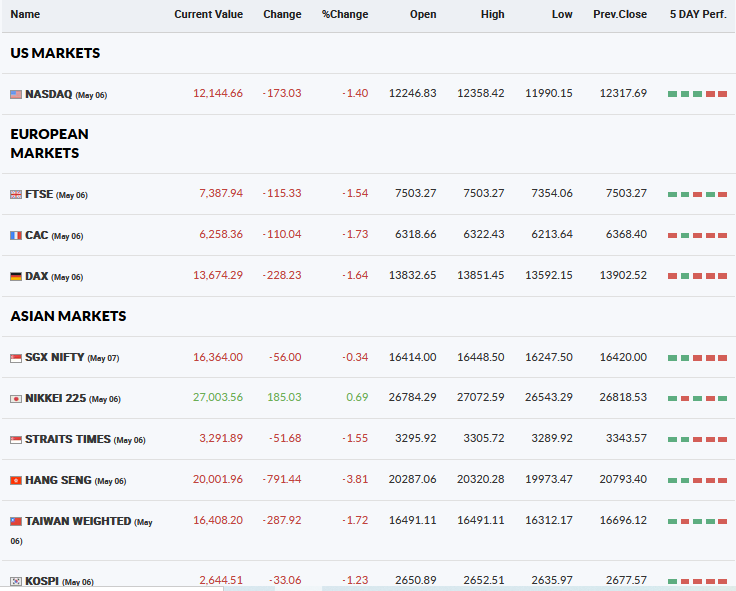
Global Markets
- NASDAQ is in deep red, down by -173.03 points or -1.40%
- Dow Futures was down by -0.51% or -168 points
- European markets have all closed in deep red
- SGX Nifty was down by -56 points or -0.34%
FII, DII, USDINR, Crude Oil
- FII sold Rs 2490.26 crores in index futures and bought Rs 5041.61 crores in index options on Friday i.e. 6th May 2022.
- USDINR was up 0.77% and closed at 77.09
- Brent Crude rallied 2.09% higher on 7 May 2022
Conclusion: After analyzing Bank Nifty’s EOD chart, RSI, global markets and other indicators, it is clear that any rally on the upside may get sold off in this week.
The only hope in the near term is if RSI reaches 20 on daily timeframe and 40 on weekly, it will be interesting to watch if downward journey takes a pause or even give a small relief rally in the market (just before LIC listing?). But, the upside for bank nifty clearly looks restricted near 36k for this week’s expiry.
Avoid taking any positions if there is a huge or decent gap down. Watch for the levels mentioned above and check the price action before taking a trade.
Overall bias is clearly negative and it is a sell on rally market unless data and indicators change!
Follow us on:
Twitter: https://twitter.com/aim_arrow
Telegram: https://t.me/aimarrow
Instagram: https://www.instagram.com/aim_arrow/
Facebook: https://www.facebook.com/aimarrow/