Relative Strength Index (RSI) Technical Indicator – History, Formula, Uses, Pros & Cons, and Pitfalls
Introduction: What is the RSI Indicator?
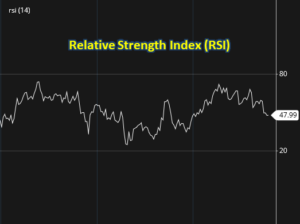
The full form of RSI is Relative Strength Index. Relative Strength Index (RSI) is a popular technical indicator used in stock market analysis. The RSI is a momentum oscillator that measures the speed and change of price movements.
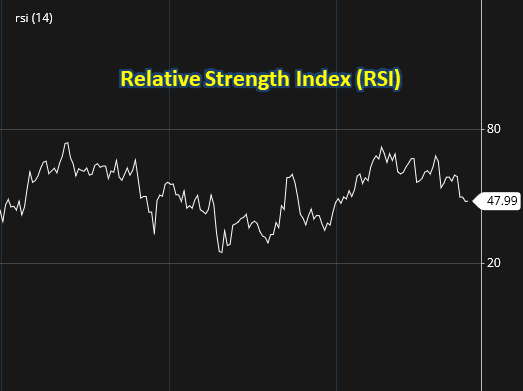
The RSI is a single line indicator that moves up and down between zero and 100. When the RSI is above 70, it is considered overbought; when the RSI is below 30, it is considered oversold. When the market is trending, the RSI will usually trend in the same direction. However, when the market is in a trading range, the RSI will often fluctuate between overbought and oversold levels.
History of RSI:
The RSI was developed by J. Welles Wilder Jr. in 1970s and was introduced to the trading community in 1978. Wilder believed that the RSI could be used to identify overbought and oversold conditions, which could help traders to identify potential reversals in the market. It was initially designed to analyze commodity markets but quickly gained popularity across various financial markets.
Formula of RSI:
The RSI formula calculates a numerical value between 0 and 100, representing the strength and momentum of a stock’s price. The RSI is calculated by dividing the average of the up-close prices by the average of the down-close prices. The RSI is then multiplied by 100 to get a percentage. The formula is as follows:
RSI = 100 – [100 / (1 + (Average Gain / Average Loss))]
RSI Settings on Chart

- Period: The default period setting is 14, meaning the RSI will consider the past 14 periods to calculate its value. Traders often adjust this period based on their trading style and the timeframe they are analyzing. Shorter periods (e.g., 7 or 9) are more sensitive to recent price changes and can be suitable for short-term trading, while longer periods (e.g., 21 or 28) provide a broader view and are commonly used for longer-term analysis.
- Overbought and Oversold Levels: The common levels used are 70 and 30 or 80 and 20.
How to Use the RSI
The RSI can be used to identify overbought and oversold conditions in an asset, offering potential entry and exit points for trades. When the RSI is above 70, it is considered overbought. This means that the market has been rising too quickly and is likely to reverse or pullback. When the RSI is below 30, it is considered oversold. This means that the market has been falling too quickly and is likely to bounce or reverse the trend. Some traders may use different levels for overbought and oversold, such as 80 and 20, for a more conservative approach, while others may experiment with different period lengths to suit their trading style.
Traders can use RSI in multiple ways, including identifying trend reversals, confirming price trends, and implementing divergence strategies. RSI can be combined with other technical indicators for enhanced analysis.
Best Way to Use RSI:
The best approach is to integrate RSI into a comprehensive trading strategy that combines multiple indicators, chart patterns, and fundamental analysis. RSI should be used as a tool to support decision-making rather than the sole basis for trading choices.
RSI Divergence:
A divergence occurs when the RSI moves in the opposite direction of the price. A bullish divergence occurs when the price is making a new low but the RSI is making a higher low. This is a sign that the market is about to make a reversal. A bearish divergence occurs when the price is making a new high but the RSI is making a lower high. This is a sign that the market is about to make a reversal.
Advantages and Disadvantages of the RSI
The RSI is a popular technical indicator that can be used to identify overbought and oversold conditions. Advantages of RSI include its simplicity, effectiveness in identifying overbought/oversold levels, and the ability to generate timely trade signals. However, the RSI also has some disadvantages.
- The RSI can be used to identify overbought and oversold conditions, but it cannot predict when the market will reverse.
- The RSI can be used to identify divergences, but these divergences are not always reliable.
- The RSI can be used to identify trends, but it cannot predict when the trend will end.
How to Avoid the Pitfalls of Using the RSI
The RSI is a powerful tool, but it can also be dangerous if it is not used properly. RSI, like any indicator, is not infallible and can generate false signals during volatile or range-bound market conditions. Here are a few tips to help you avoid the pitfalls of using the RSI:
- Do not use the RSI in isolation. Always use the RSI in conjunction with other technical indicators and fundamental analysis.
- Do not use the RSI to make trading decisions. The RSI can be used to identify potential trading opportunities, but it should not be used to make the final decision to buy or sell.
- Do not over-trade. The RSI can be used to identify potential trading opportunities, but it is important to be patient and wait for the right opportunity.
Common Misconceptions of RSI:
Misconceptions include using RSI as a standalone indicator, disregarding other market factors, and assuming overbought/oversold conditions always lead to immediate reversals.
Applicability to Different Trading Markets:
RSI can be used for stocks, commodities, and currency trading. However, market characteristics and price dynamics may differ across these asset classes, requiring adjustments in RSI parameters and interpretation.
Relative Strength vs. RSI:
Relative strength compares the performance of one asset to another, while RSI measures the internal strength of a single asset. Both provide valuable insights but serve different purposes.
Conclusion
The Relative Strength Index (RSI) is a widely used technical indicator that helps traders identify overbought and oversold conditions in the market. By understanding the RSI formula, interpreting buy and sell signals, and following best practices, traders can leverage RSI to enhance their trading strategies. Remember to use RSI in conjunction with other tools and adapt its parameters to suit the specific market being analyzed. With proper utilization, RSI can be a valuable asset in your trading toolkit.
We encourage you to participate in the following fan poll on fanrank.org:
Which technical analysis indicators do you use while trading in stock market? Vote in the link below: FanRank’s Finance Polls