Ichimoku Clouds Technical Analysis Indicator – History, Uses, Application, Default Settings, Signals, Pros & Cons, Misconceptions and Best Practices
Introduction to Ichimoku Clouds:
Ichimoku Clouds is a powerful and versatile technical analysis indicator that can be used to identify trend direction, gauge momentum, define support and resistance levels, and provide traders with potential buy or sell signals. It offers a comprehensive framework for analyzing price action, volume, and time.
In this article, we will explore the history, definition, parameters, formulas, application, and best practices of Ichimoku Clouds. We will also examine its advantages, disadvantages, risks, rewards, and common misconceptions, while addressing its effectiveness in different trading markets such as stocks, commodities, and currencies.
An Analogy to Explain Ichimoku Clouds:
Think of Ichimoku Clouds as a “market weather forecast.” Just as clouds provide valuable information about upcoming weather conditions, Ichimoku Clouds offer insights into the prevailing market sentiment, helping traders make informed decisions.
History of Ichimoku Clouds:
Developed by Japanese journalist Goichi Hosoda in the late 1960s, Ichimoku Clouds, also known as Ichimoku Kinko Hyo, emerged as a comprehensive technical analysis tool in the Japanese stock market. Its popularity grew globally, thanks to its ability to provide multi-dimensional insights into market conditions.
The Ichimoku Cloud is made up of five lines:
Tenkan Sen (Conversion Line): It represents the average of the highest high and lowest low over a specific period. This is a nine-period moving average.
Kijun Sen (Base Line): It indicates the average of the highest high and lowest low over a longer period. This is a 26-period moving average.
Senkou Span A and B (Leading Span A and B): These lines form the Cloud, offering insights into support and resistance levels and potential trend shifts.
- Senkou Span A (Leading Span A): This is a 52-period moving average of the Tenkan-Sen and Kijun-Sen.
- Senkou Span B (Leading Span B): This is a 52-period moving average of the highs and lows of the past 52 periods.
Chikou Span (Lagging Span): It plots the closing price of the current period, shifted backward by the value of the Kijun Sen. This is the closing price of the current day plotted 26 periods behind.
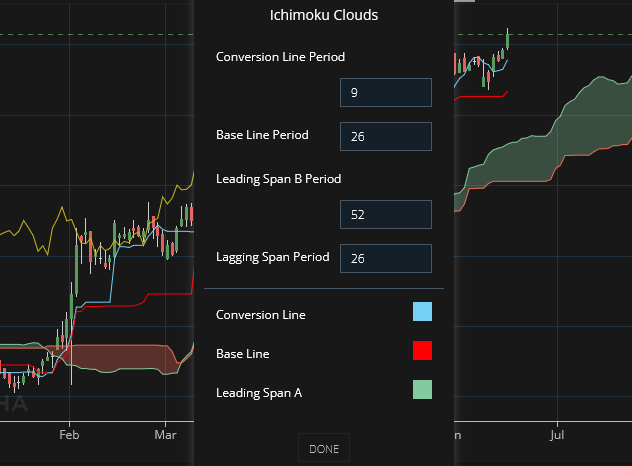
The default settings for Ichimoku Clouds often include a 9-day period for the Tenkan Sen, a 26-day period for the Kijun Sen, and a 52-day period for the Senkou Span B. However, these settings can be adjusted based on individual preferences and trading strategies.
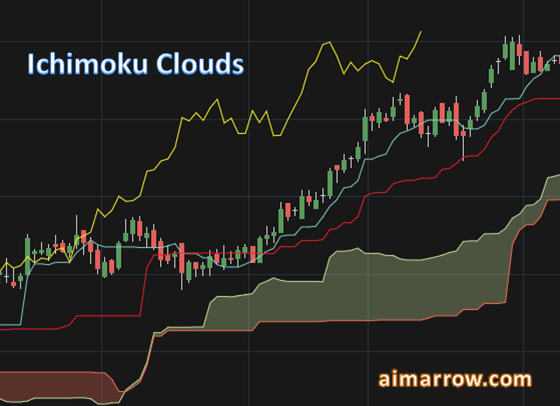
The Ichimoku Cloud is plotted as a shaded area between the Senkou Span A and Senkou Span B lines. When the price is above the cloud, it is considered to be in an uptrend. When the price is below the cloud, it is considered to be in a downtrend.
Ichimoku Clouds Calculation:
The calculations involve plotting the various lines and spans based on the specified parameters. Most charting platforms and technical analysis tools perform these calculations automatically, enabling traders to focus on interpretation rather than manual computations.
The formulas for each component of Ichimoku Clouds are as follows:
- Tenkan Sen: (Highest High + Lowest Low) / 2 over a specific period
- Kijun Sen: (Highest High + Lowest Low) / 2 over a longer period
- Senkou Span A: (Tenkan Sen + Kijun Sen) / 2, plotted forward by the value of the Kijun Sen
- Senkou Span B: (Highest High + Lowest Low) / 2 over an even longer period, plotted forward by the value of the Kijun Sen
- Chikou Span: Closing price plotted backward by the value of the Kijun Sen
How to Use Ichimoku Clouds:
There are a number of ways to use Ichimoku Clouds to trade. Some common methods include:
Buy signals: When the price breaks above the cloud, it is a signal to buy.
Sell signals: When the price breaks below the cloud, it is a signal to sell.
Crossover signals: When the Tenkan-Sen crosses above the Kijun-Sen, it is a signal that the trend is likely to continue in the same direction. When the Tenkan-Sen crosses below the Kijun-Sen, it is a signal that the trend is likely to reverse.
Chikou Span signals: When the Chikou Span crosses above the price, it is a signal that the trend is likely to continue in the same direction. When the Chikou Span crosses below the price, it is a signal that the trend is likely to reverse.
Most Commonly Used Ichimoku Cloud Settings:
Traders commonly use variations of the default settings to adapt Ichimoku Clouds to different timeframes and markets. For shorter timeframes, they may reduce the period lengths, while for longer timeframes, they may increase them.
Ichimoku Clouds Buy and Sell Signals:
Buy signals occur when the Conversion Line crosses above the Base Line, and the price is above the Cloud. Sell signals occur when the Conversion Line crosses below the Base Line, and the price is below the Cloud. Traders also analyze the Cloud’s thickness and the Lagging Span’s position to confirm signals.
Best Practices for Using Ichimoku Clouds
- Use multiple timeframes: Ichimoku Clouds can be used on multiple timeframes, such as the daily, weekly, and monthly charts. This can help you to gain a broader perspective, identify trends and patterns that are not visible on shorter timeframes.
- Wait for confirmation: Don’t trade every signal that Ichimoku Clouds generates. Wait for confirmation from other indicators or price action before entering a trade.
- Use stop losses: Always use stop losses to protect your profits and limit your losses.
- Consider the prevailing market trend and sentiment.
- Regularly review and adjust settings based on market conditions.
- Combine Ichimoku Clouds with other indicators for comprehensive analysis. This can enhance the accuracy of signals and reduce false positives.
Pros and Cons of Ichimoku Clouds:
Pros:
- Provides a holistic view of market trends, support and resistance levels, and gauges momentum.
- Offers clear buy and sell signals when used in conjunction with other indicators.
- Helps identify potential trend shifts and reversals.
- Suitable for various markets and timeframes.
Cons:
- They can be difficult to interpret, especially for beginners. Requires practice and experience to interpret signals accurately.
- They can generate a lot of false signals. False signals can occur during choppy or ranging markets.
- Ichimoku Clouds can be lagging indicators, meaning that they may not always provide timely signals. May lag in highly volatile or rapidly changing markets.
- Relies on historical price data and may not account for unforeseen events.
Risks of Using Ichimoku Clouds:
As with any technical analysis tool, Ichimoku Clouds carry risks. Reliance solely on this indicator without considering other factors can lead to false signals, missed opportunities, or delayed actions. It is essential to combine it with thorough analysis and risk management strategies.
Rewards of Using Ichimoku Clouds:
When used correctly, Ichimoku Clouds offer traders a comprehensive framework for analyzing market trends, identifying potential entry and exit points, and managing risk. It provides a structured approach to decision-making and can contribute to consistent profits when integrated into a robust trading strategy.
Whipsaws of Ichimoku Clouds:
Whipsaws occur when the price moves back and forth across the Cloud or when the Conversion Line and Base Line frequently cross over each other, generating false signals. Traders should exercise caution during such market conditions and consider additional confirmation indicators.
Common Misconceptions of Ichimoku Clouds:
One common misconception is that Ichimoku Clouds can predict future price movements with absolute certainty. While it is a powerful indicator, it should be used in conjunction with other tools to validate signals and consider the broader market context.
Success Rate of Ichimoku Cloud Strategy:
The success rate of the Ichimoku Cloud strategy varies depending on various factors, including market conditions, timeframes, and the trader’s skill and experience. Like any trading strategy, success relies on proper implementation, risk management, and continuous adaptation to changing market dynamics.
Applicability to Stock, Commodities, and Currency Trading:
Ichimoku Clouds can be applied to various trading markets, including stocks, commodities, and currencies. However, it is important to note that the default settings for Ichimoku Clouds may not be optimal for all markets. It’s essential to consider the specific characteristics of each market and adjust the parameters and settings accordingly. For example, you may need to adjust the timeframes or parameters depending on the market you are trading.
Conclusion:
Ichimoku Clouds are a powerful technical analysis indicator that can be used to identify trends, gauge momentum, and define support and resistance levels. However, they are not without their drawbacks, such as being lagging indicators and generating false signals. It is important to use Ichimoku Clouds in conjunction with other indicators, risk management strategies and price action to minimize the risk of false signals and maximize their effectiveness in trading various markets.
We encourage you to participate in the following fan poll on fanrank.org:
Crown the best technical indicator
Vote for the best mobile app for trading and investing