A-Z List Of All The Indicators/Studies In Stock Market
- ADX/DMS
- ATR Bands
- ATR Trailing Stops
- Accumulation/Distribution
- Accumulative Swing Index
- Alligator
- Anchored VWAP
- Aroon
- Aroon Oscillator
- Average True Range
- Awesome Oscillator
- Balance of Power
- Beta
- Bollinger %b
- Bollinger Bands
- Bollinger Bandwidth
- Candlestick Patterns
- Center Of Gravity
- Central Pivot Range
- Chaikin Money Flow
- Chaikin Volatility
- Chande Forecast Oscillator
- Chande Momentum Oscillator
- Choppiness Index
- Commodity Channel Index
- Coppock Curve
- Correlation Coefficient
- Darvas Box
- Detrended Price Oscillator
- Disparity Index
- Donchian Channel
- Donchian Width
- Ease of Movement
- Ehler Fisher Transform
- Elder Force Index
- Elder Impulse System
- Elder Ray Index
- Fractal Chaos Bands
- Fractal Chaos Oscillator
- Gator Oscillator
- Gopalakrishnan Range Index
- High Low Bands
- High Minus Low
- Highest High Value
- Historical Volatility
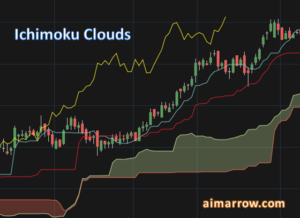
- Ichimoku Clouds
- Intraday Momentum Index
- Keltner Channel
- Klinger Volume Oscillator
- Linear Reg Forecast
- Linear Reg Intercept
- Linear Reg R2
- Linear Reg Slope
- Lowest Low Value
- MACD
- MACD Divergence
- Market Facilitation Index
- Mass Index
- Median Price
- Momentum Indicator
- Money Flow Index
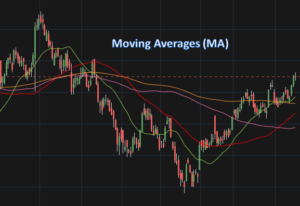
- Moving Average
- Moving Average Deviation
- Moving Average Envelope
- Negative Volume Index
- On Balance Volume
- Open Interest
- Parabolic SAR
- Performance Index
- Pivot Points
- Positive Volume Index
- Pretty Good Oscillator
- Price Momentum Oscillator
- Price Oscillator
- Price Rate of Change
- Price Relative
- Price Volume Trend
- Prime Number Bands
- Prime Number Oscillator
- Pring’s Know Sure Thing
- Pring’s Special K
- Psychological Line
- QStick
- RAVI
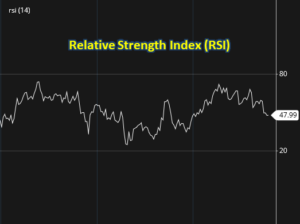
- RSI
- RSI Divergence
- Rainbow Moving Average
- Rainbow Oscillator
- Random Walk Index
- Relative Vigor Index
- Relative Volatility
- STARC Bands
- Schaff Trend Cycle
- Shinohara Intensity Ratio
- Standard Deviation
- Stochastic Divergence
- Stochastic Momentum Index
- Stochastic RSI
- Stochastics
- Super Trend
- Swing Index
- TRIX
- Time Series Forecast
- Trade Volume Index
- Trend Intensity Index
- True Range
- Twiggs Money Flow
- Typical Price
- Ulcer Index
- Ultimate Oscillator
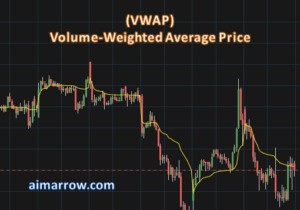
- VWAP
- Valuation Lines
- Vertical Horizontal Filter
- Volume Chart
- Volume Oscillator
- Volume Profile
- Volume Rate of Change
- Volume Underlay
- Vortex Index
- Weighted Close
- Williams %R
- ZigZag
The above 122 indicators or studies can be used individually or in combination, in order to assess or help in calculating various aspects like price direction, range, price levels etc of the trading asset.