The Engulfing Candlestick Patterns – Bullish Engulfing, Bearish Engulfing
What Are Engulfing Candlestick Patterns?
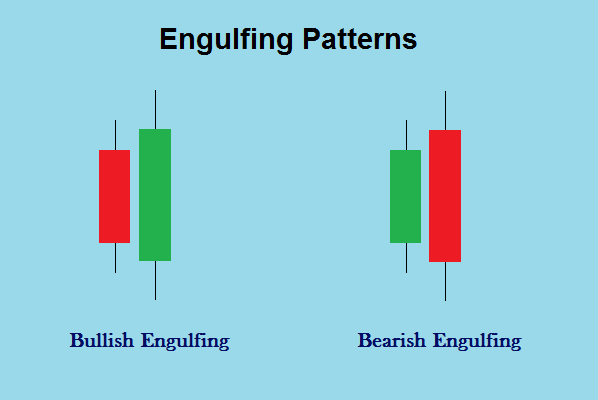
Engulfing means to cover completely or submerge. The engulfing candlestick patterns reflect the same. These patterns involves two candlesticks where a long candle forms right after a relatively small candle. In other words the long candle engulfs the smaller candle completely.
Types Of Engulfing Candlestick Patterns
There are two types of engulfing patterns – the bullish engulfing pattern and bearish engulfing pattern. Check the image below for how these engulfing patterns look.

Bullish Engulfing Pattern
In this pattern, a red/black (bearish) candle will be followed by a green/white/blue (bullish) candle. In other words, the bullish (green) candle is longer than the bearish (red) candle, engulfing it completely.
This pattern works when it appears on the charts at the bottom of a down trend. As per the definition, you’d want the green candle to completely cover the red candle i.e even the upper and lower shadows along with the real body of the red candle.
Psychology Behind The Bullish Engulfing Pattern
During a down trend, the market keeps falling making new lows. On the day before the bullish engulfing pattern forms, the market as expected moves lower, forming a red candle. The next day the stock price opens near the previous day’s closing price and attempts to make a new low. However, at this low point of the day there is a
sudden buying interest, which drives the prices to close higher than the previous day’s open forming a green candle. This indicates that the bull’s attempt to restrict the prices from falling further, and thereby reversing the trend was successful. One should look to buy after such movement as the bullishness is expected to continue over the next few successive trading sessions.
Bearish Engulfing Pattern
The bearish engulfing pattern is just the opposite to the bullish engulfing pattern. In this pattern, a bullish (green/white/blue) candle will be followed by a bearish (red/black) candle. In other words, the bearish (green) candle is longer than the bullish (red) candle i.e. the bearish candle engulfs the bullish candle.
This pattern works when it appears on the charts at the top of an up trend. As per the definition, you’d want the red candle to completely cover the green candle i.e even the upper and lower shadows along with the real body of the red candle.
Psychology Behind The Bearish Engulfing Pattern
Quite opposite to the bullish engulfing pattern, at the top of an up trend, the bearish candle completely engulfing the bullish candle means the bears were successful in reversing the trend. One should look to sell after such movement as the bearishness is expected to continue over the next few successive trading sessions.


