Skip to content
May 25, 2025
  • Facebook
  • Twitter
  • Telegram
  • YouTube
  • Instagram
  • Pinterest
  • Tumblr
  • Reddit
  • LinkedIn

Aim Arrow

Target the Bull's Eye!

Primary Menu

Aim Arrow

  • Home
  • Stock Market Views
  • Basics of Investment
  • Introduction to Stock Market
  • Technical Analysis
    • Single Candlestick Pattern
    • Multiple Candlestick Patterns
    • Dow Chart Patterns
    • Technical Indicators
    • W. D. Gann Analysis
  • Fundamental Analysis
  • Derivatives
    • Futures
    • Options
      • Bullish Options Strategies
      • Bearish Options Strategies
      • Neutral Options Strategies
      • Other Options Strategies
  • Market Psychology
  • Market Strategies
  • Books
  • Lists
  • Company Profiles
    • Nifty 50 Companies
    • Dow 30
  • News & Updates
  • Quotes
    • Warren Buffet Quotes
    • 365 Days Motivation
  • Open a Demat/Trading Account
    • Kotak Securities
    • Zerodha
  • Python Programming
  • Screeners
    • NSE, BSE Stocks Screener
    • NASDAQ, NYSE Stocks Screener
    • LSE, LSIN Stocks Screener
    • ASX Stocks Screener
    • TSX, TSXV, CSE, NEO Stocks Screener
    • MIL, MILSEDEX Stocks Screener
    • FWB, SWB, XETR Stocks Screener
    • TASE Stocks Screener
    • EGX Stocks Screener
    • BIST Stocks Screener
    • Forex Screener
    • Cryptocurrency Screener
  • IPO
  • Blog
  • Home
  • Technical Analysis
  • Dow Chart Patterns
  • Head and Shoulders Chart Pattern
  • Dow Chart Patterns

Head and Shoulders Chart Pattern

0

will be updated soon..

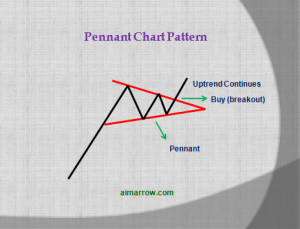
Tags: candlestick pattern, candlestick patterns, Chart Pattern, chart patterns, charts, dow chart patterns, H&S Chart, H&S Chart Pattern, H&S Pattern, Head and Shoulders, Head and Shoulders Chart, Head and Shoulders Chart Pattern, Head and Shoulders Pattern, stock market, technical analysis, technical analysis using charts

Continue Reading

Previous Cup and Handle Chart Pattern
Next Bump and Run Reversal Chart Pattern

Related Articles

pennant candlestick chart pattern feature image
  • Dow Chart Patterns

Pennant Chart Pattern

0
  • Dow Chart Patterns

Measured Move – Bullish Chart Pattern

0
  • Dow Chart Patterns

Measured Move – Bearish Chart Pattern

0

FanRank.org

Participate in Stock Market Fan Polls
Only on Fan Rank’s Finance Events!

Recent Posts

  • Everything About Volume-Weighted Average Price (VWAP) Technical Analysis Indicator
  • Ichimoku Clouds Technical Analysis Indicator – History, Uses, Application, Default Settings, Signals, Pros & Cons, Misconceptions and Best Practices
  • Moving Averages Technical Analysis Indicators – History, Types, Uses, Pros & Cons, Misconceptions, Commonly Used MAs and Best Practices
  • Relative Strength Index (RSI) Technical Indicator – History, Formula, Uses, Pros & Cons, and Pitfalls
  • Stock Picking Made Easy: These Stock Scanners Will Help You Scan Stocks Effortlessly And Save Time!

RSS Aim Arrow

  • Everything About Volume-Weighted Average Price (VWAP) Technical Analysis Indicator
  • Ichimoku Clouds Technical Analysis Indicator – History, Uses, Application, Default Settings, Signals, Pros & Cons, Misconceptions and Best Practices
  • Moving Averages Technical Analysis Indicators – History, Types, Uses, Pros & Cons, Misconceptions, Commonly Used MAs and Best Practices
  • Relative Strength Index (RSI) Technical Indicator – History, Formula, Uses, Pros & Cons, and Pitfalls
  • Stock Picking Made Easy: These Stock Scanners Will Help You Scan Stocks Effortlessly And Save Time!
  • Improve Trading Psychology With Meditation
  • More and more pain looming in Bank Nifty!
  • Will We Witness Bank Nifty Put Writers Covering Their Shorts Tomorrow? Read On To Know All The Scenarios…
  • Bank Nifty Pullback Rally May Extend On Tuesday But Upside Looks Restricted
  • More Pain In Bank Nifty! Find Out The Reason With The Help Of Our Detailed Analysis:

RSS NSE News – Latest Corporate Announcements

You May Have Missed

Volume-Weighted Average Price (VWAP)
  • Technical Indicators

Everything About Volume-Weighted Average Price (VWAP) Technical Analysis Indicator

0
Ichimoku Clouds
  • Technical Indicators

Ichimoku Clouds Technical Analysis Indicator – History, Uses, Application, Default Settings, Signals, Pros & Cons, Misconceptions and Best Practices

0
Moving Averages (MA)
  • Technical Indicators

Moving Averages Technical Analysis Indicators – History, Types, Uses, Pros & Cons, Misconceptions, Commonly Used MAs and Best Practices

0
Relative Strength Index (RSI)
  • Technical Analysis
  • Technical Indicators

Relative Strength Index (RSI) Technical Indicator – History, Formula, Uses, Pros & Cons, and Pitfalls

0
  • Lists

Stock Picking Made Easy: These Stock Scanners Will Help You Scan Stocks Effortlessly And Save Time!

0
  • Privacy Policy
  • |
  • Disclaimer
  • |
  • FanRank.org
  • Facebook
  • Twitter
  • Telegram
  • YouTube
  • Instagram
  • Pinterest
  • Tumblr
  • Reddit
  • LinkedIn
Copyright © All rights reserved. | Aim Arrow Stock Market Education