Dark Cloud Cover Candlestick Pattern
What Is The ‘Dark Cloud Cover’ Candlestick Pattern?
The Dark Cloud Cover candlestick pattern is a bearish reversal candlestick pattern. The pattern got this name because of its resemblance to a cloud covering an hillock. Dark reflects pessimism here.
Dark cloud cover pattern is very similar to the bearish engulfing pattern with a minor variation, and is also the counter part of the ‘Piercing’ candlestick pattern.
Formation Of The Dark Cloud Cover Pattern
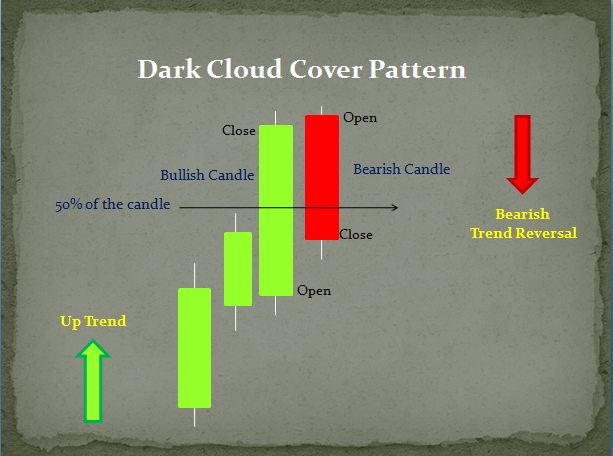
It is formed by the combination of two candlesticks. The first candle is a trending white candle and the second is the reversal black candlestick.
In a bearish engulfing pattern, the red/bearish candle engulfs the green/bullish candle completely. However, in the dark cloud cover pattern, the red/bearish candle engulfs about 50% to 100% of the green/bullish candle’s real body. Example, if the green candle’s range (Open – Close) is 10, the red candle’s range should be at least 5 or higher.
Psychology Behind The Dark Cloud Cover Pattern
During an up trend, the market keeps making new highs. On the first day (or specified time period) of the dark cloud cover pattern formation, the market as expected moves higher, forming a green bullish candle. Next day, the price opens above the previous day’s closing price and attempting to make a new high. At the high point of the day, there is sudden selling interest from the bears, which drives the prices lower. But the buyers are still happy to buy on the decline.
However, the bears keep selling and also force those who bought at the high price to cover their long position to limit the loss. At the end of the day, the price closes below its opening price covering about 50% to 100% length of the previous day’s green candle. This indicates that the bears are taking control of the market. One should look to sell after such movement as the bearishness is expected to continue over the next few successive trading sessions.
Significance Of The Dark Cloud Cover Candlestick Pattern
As shown in the above image, the ‘dark cloud cover’ candlestick pattern is effective in an up trending market and signals bearish trend reversal on the charts.
Significance of the dark cloud cover pattern increases if second day’s opening price is above a resistance area and close is below the resistance area. If the second candle is a bearish marubozu or with no upper or lower shadow, it implies more bearishness in the market. Its importance is even more if it is accompanied by increased volume.