Nifty Final Resistance Tested | Is This The Start Of A CORRECTION?
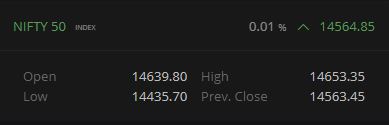
Nifty OHLC on 13 Jan 2021
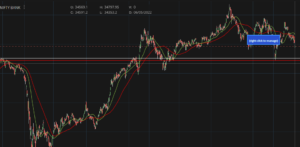
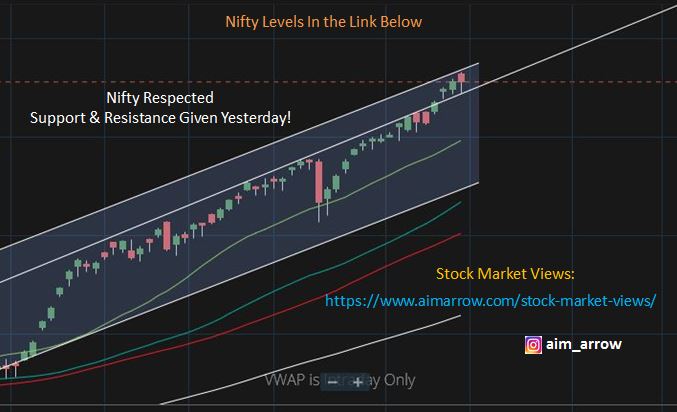
Nifty opened exactly at my resistance level of 14640 which was given in yesterday’s analysis. It opened at 14639.80 and marked it’s new all time high of 14653.32 (13th trading session in a row).
Nifty did not sustain above the resistance and later tested my support level (14440) given yesterday. It marked it’s day’s low at 14435.70 and soon reversed from the support and re-tested my previous support (14560). Nifty closed at 14564.85.
What does Nifty’s EOD Chart tell us?
As mentioned above, Nifty touched our resistance first and later the support level to form a bearish candle at the top of the trend line. Nifty needs to breakout of either end to make it’s move further.
Formation of a bearish candle at the top is not looking convincing. Add to that, it reversed exactly from the resistance level. I will be looking for a breakout on the downside from here. As per the Nifty EOD chart, the next support is at 14240-260 zone.
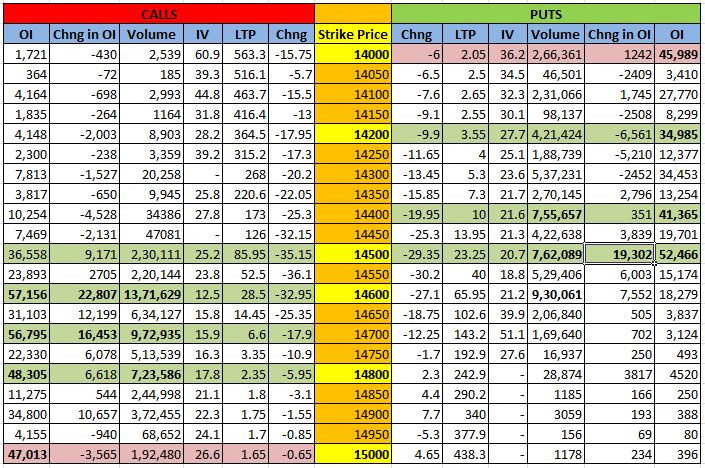
Nifty Open Interest (OI)
Calls: The highest OI on the calls side has moved from 15000 to 14600. As you can see in the table below, there is a significant change in the OI of 14600 strike price along with volumes. It should act as a firm resistance tomorrow. There is lot of call writing seen at the higher strikes as well.
The next highest OI is at 14700 which will act as the next resistance.
Resistance Levels: 14560, 14640
Puts: The highest OI on the put side is at 14500 strike price followed by 14000 strike. There is a significant change in the OI of 14500 strike price along with volumes.
Support Levels: 14500, 14440, 14240-260, 14000
Looking at the OI data, I sense tomorrow will be a range bound day. The range is very small within 100 points between 14500 and 14600.
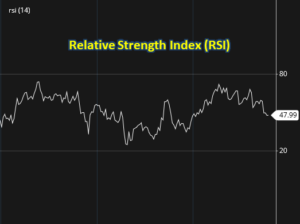
Daily RSI is still above 80 at 80.60. If it starts going below 80, watch-out for a correction!
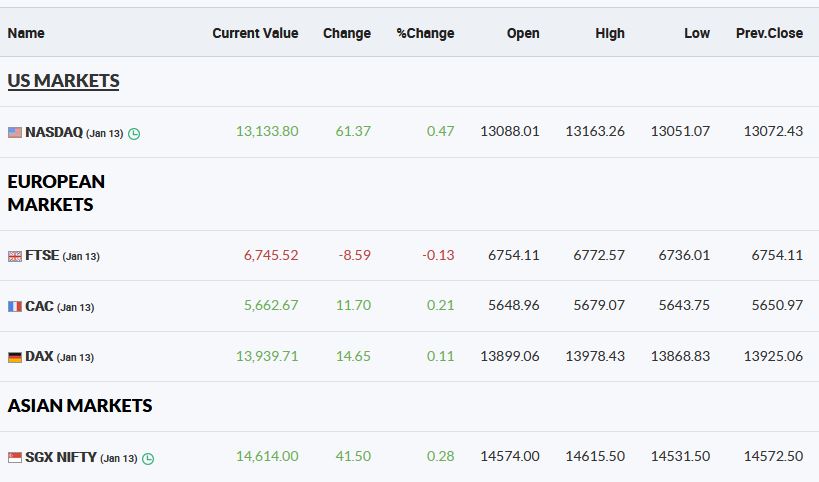
Global Markets
- The EU markets closed almost flat
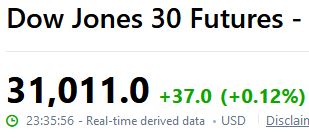
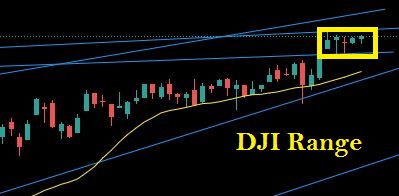
- Dow Jones and NASDAQ are also flat while I’m writing this analysis
- Dow Jones Futures and SGX Nifty are also trading flat
DJI has been moving in a tight range from the past 5 trading sessions.
Conclusion: Putting all the data together, for me Nifty is bearish. If Nifty breaks the trend line near 14440, and RSI goes below 80, watch-out for a correction. Tomorrow Nifty may mostly trade in a small range as mentioned above.
Happy trading! Hope this helps, and do share if you feel this information is useful! 🙂
Follow us on:
Facebook: https://www.facebook.com/aimarrow/
Twitter: https://twitter.com/aim_arrow
Telegram: https://t.me/aimarrow
Instagram: https://www.instagram.com/aim_arrow/
Hashtags: #14Jan2021Expiry, #Nifty, #Nifty50, #NiftyBreakout, #NiftyChart, #NiftyFifty, #NiftyOI, #NiftyOpenInterest, #NiftyResistance, #NiftySupport, #NiftyTechnicalAnalysis, #NiftyView, #NiftyTA, #RSI, #Channel, #TrendLine, #MovingAverages, #niftyoutlook #AimArrow
#stock #stockmarket #trading #money #investing #stocks #investment #trader #business #finance #invest #investor #daytrader #profit #trade #market #financialfreedom #wealth #dalalstreet #wallstreet #sharemarket #motivation #entrepreneur #stocktrading #stockmarketnews #sensex #success #nse