Identifying the trend using Price and Open Interest
If you want to learn about Open Interest before getting into the uses of OI, read our previous article here.
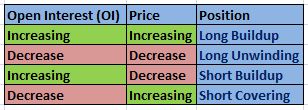
You can identify the trend of an asset by combining Open Interest (OI) with the change in price of the asset. Here are the four combinations of Open Interest and Price which will help us identify the trend of an asset:
Click on the image to view it in a new tab!
Long Buildup: If the Open Interest increases with an increase in price of the asset, it is called long buildup. It means that more people are bullish or expecting the price to move up further.
Long Unwinding: This is just the opposite of long buildup. If the OI decreases with a fall in the price of the asset, it is called long unwinding. In other words, traders who went long and met their targets have started to book their profits or started closing their positions
Short Buildup: If the OI increases and price of the asset decreases, it is called short buildup. It means that more people are bearish on the asset or expecting the price to fall further.
Short Covering: This is just the opposite of short buildup. If the OI decreases with an increase in the price of the asset, it is called short covering. In other words, traders who went short are closing/covering their positions as the price is moving against their bet. The price generally moves up drastically in this case as traders will be in a hurry to minimize their losses.